Each coin flip is an independent Bernoulli trial with near-50/50 probability. The compound effect grows with each additional flip in a chain — after 5 correct calls, the cumulative probability shift becomes significant. This free simulator helps you understand compound probability and see how small differences scale over repeated trials.
Last updated: March 28, 2026
Flip a coin and chain correct guesses for increasing multipliers. Explore how compound probability works across chains.
Free to play · No signup required
This free coin flip probability simulator models the simplest probability game. Pick Heads or Tails, and the coin is flipped. If you guess correctly, your bet is multiplied. The chain mechanic is what makes it interesting — after each win, you can choose to double down or cash out. Chain 5 correct guesses and your original bet has been multiplied approximately 16x.
Each flip is a near-50/50 event. The payout on a single correct flip is 1.98x — slightly less than the fair 2x, modeling real-world payout structures. The maximum chain is 20 consecutive correct guesses, which yields a massive theoretical multiplier — though the probability of achieving this is roughly 1 in a million.
The double-or-nothing structure makes Coin Flip a pure test of risk management. The math says your expected value decreases with each additional flip in a chain, but the psychological pull of doubling down is powerful. Use this simulator to see how compound probability works over time and understand the risk of chaining flips.
Visualize the binary decision tree at every chain depth. Each flip is a fork — guess right and the path continues with a doubled multiplier, guess wrong and it terminates. See why the expected return stays constant at 0.99 regardless of depth.
Each node splits into a surviving path (correct guess) and a terminated path (wrong guess). Hover nodes for details.
| Depth | Multiplier | Probability | Expected Return | EV per Unit |
|---|---|---|---|---|
| 1 | 1.98x | 50.000% | 0.99 | 0.99 |
| 2 | 3.96x | 25.000% | 0.99 | 0.99 |
| 3 | 7.92x | 12.500% | 0.99 | 0.99 |
| 4 | 15.84x | 6.250% | 0.99 | 0.99 |
| 5 | 31.68x | 3.125% | 0.99 | 0.99 |
| 6 | 63.36x | 1.563% | 0.99 | 0.99 |
Bar height represents probability at each depth. As multipliers grow exponentially, the chance of reaching that depth halves with every step.
Every chain depth has the same expected return (0.99 per unit). The only difference is variance — deeper chains trade frequency for magnitude. A depth-1 exit collects a small amount often; a depth-10 exit collects 1,013x rarely. Same math, different experience.
Run thousands of chain sessions with one or more exit depths and compare them side by side. See how different exit strategies affect your balance over time, and why deeper chains create wilder outcomes for the same mathematical expectation.
Discover why deeper chains are riskier even though expected return stays flat. Visualize how the spread of actual outcomes widens at every exit depth — the box-and-whisker chart makes the variance explosion unmistakable.
Honest, math-based answers about Coin Flip.
Deal. Decide. Count.

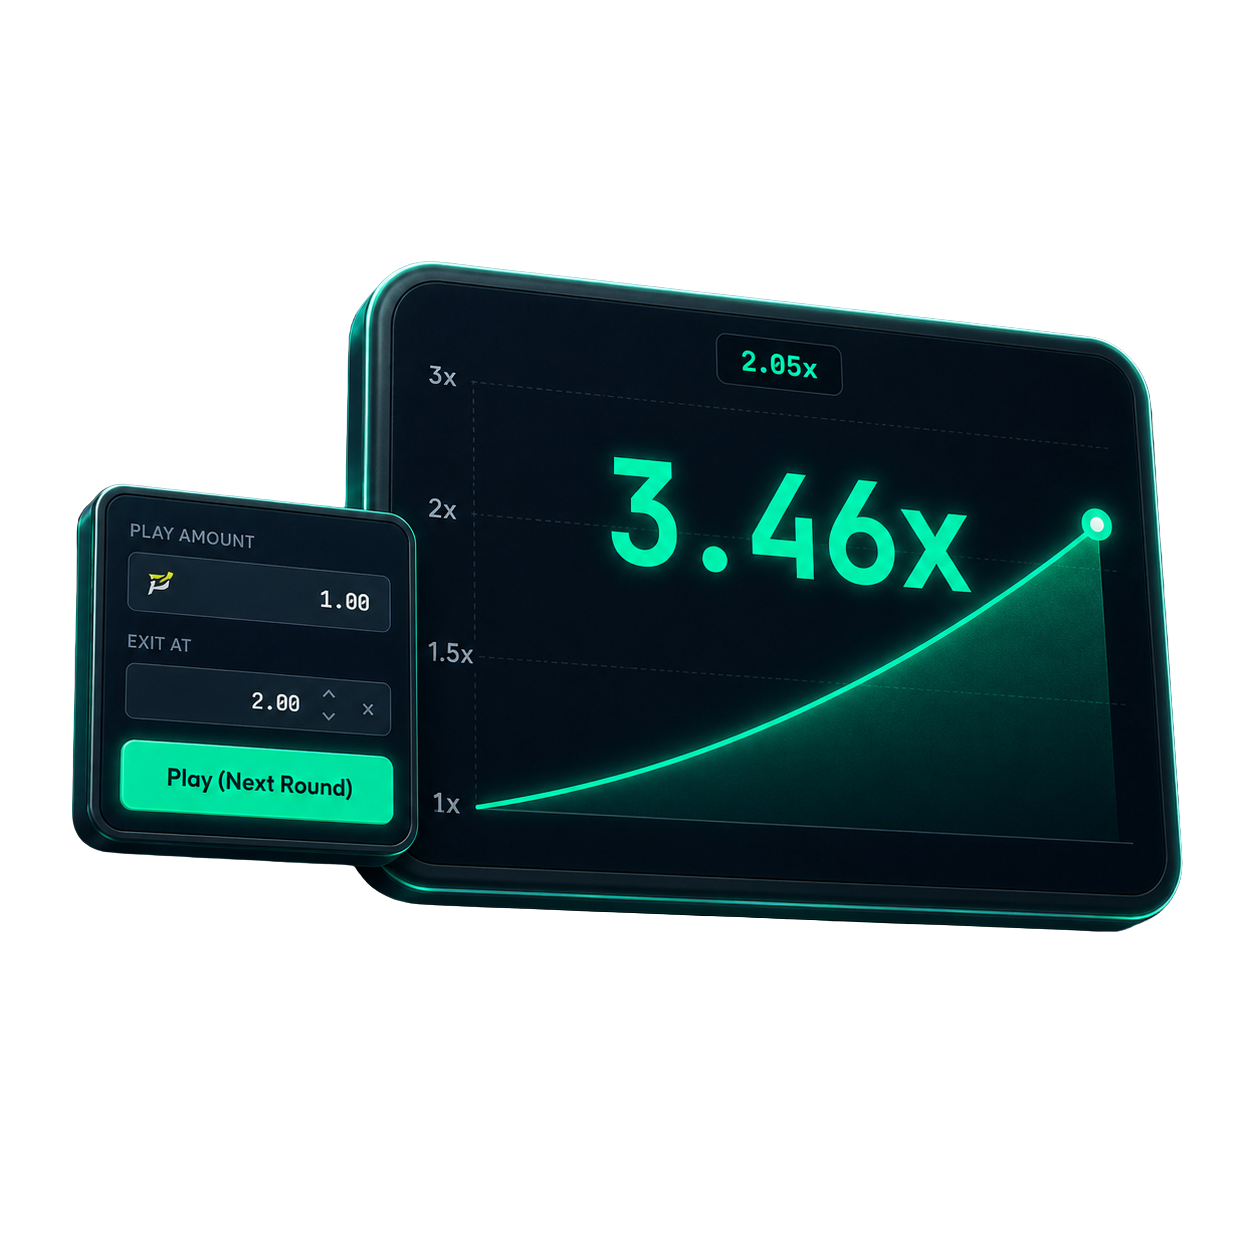
Spin. Analyze. Learn.

Drop. Bounce. Multiply.

Rise. Collect. Or crash.
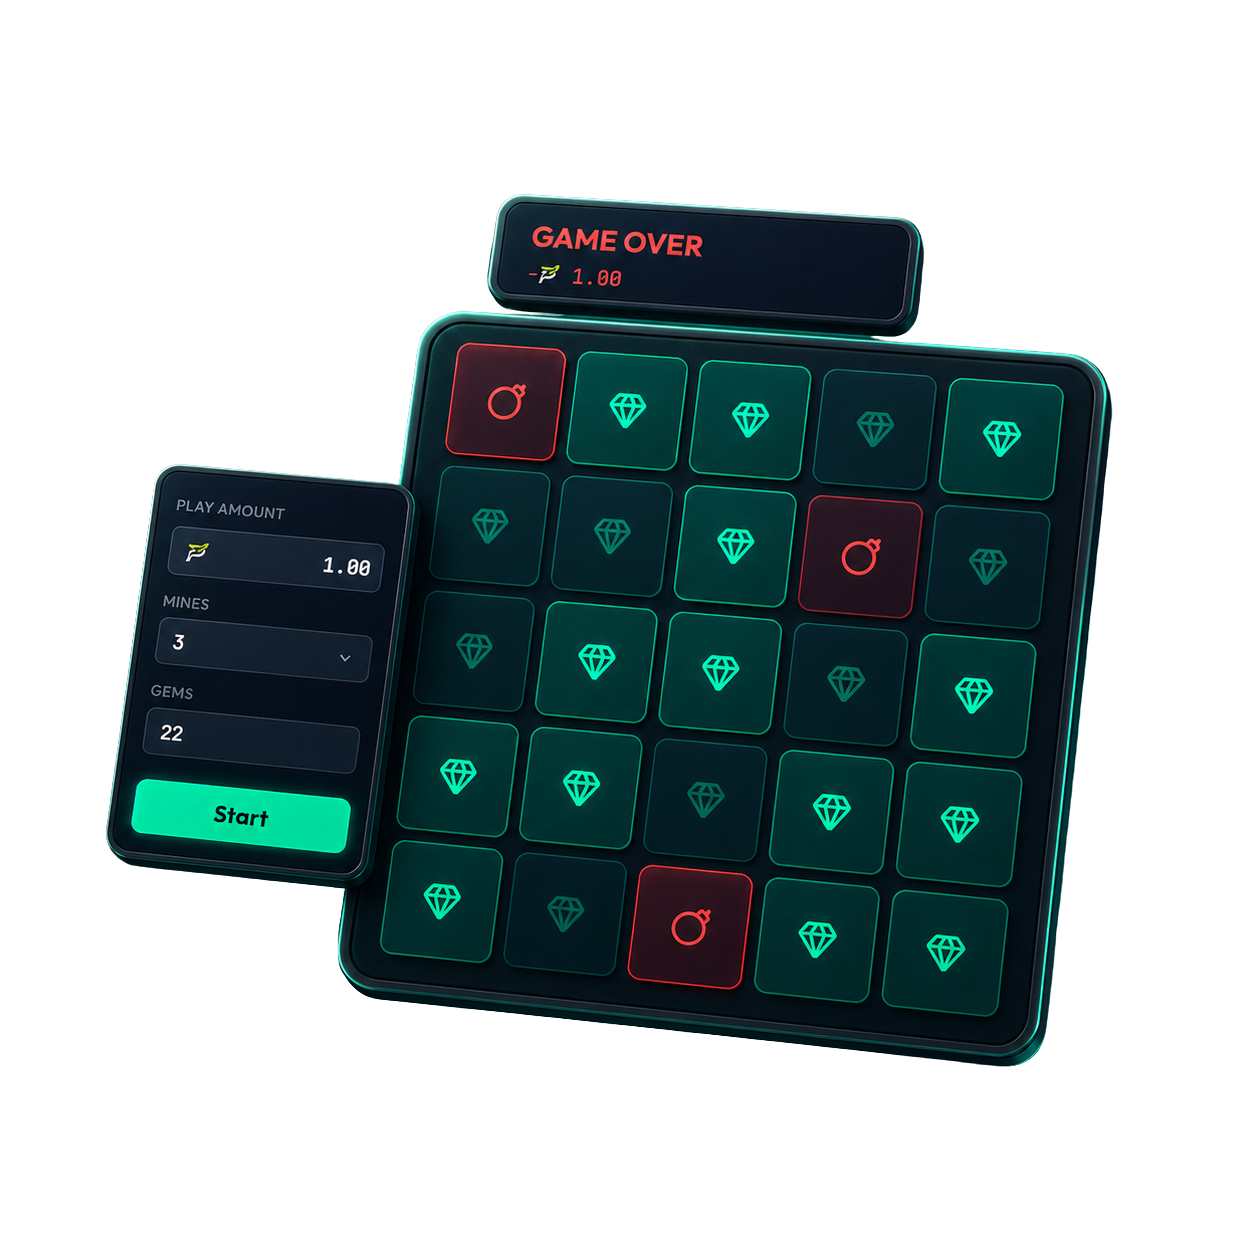
Reveal. Avoid. Multiply.
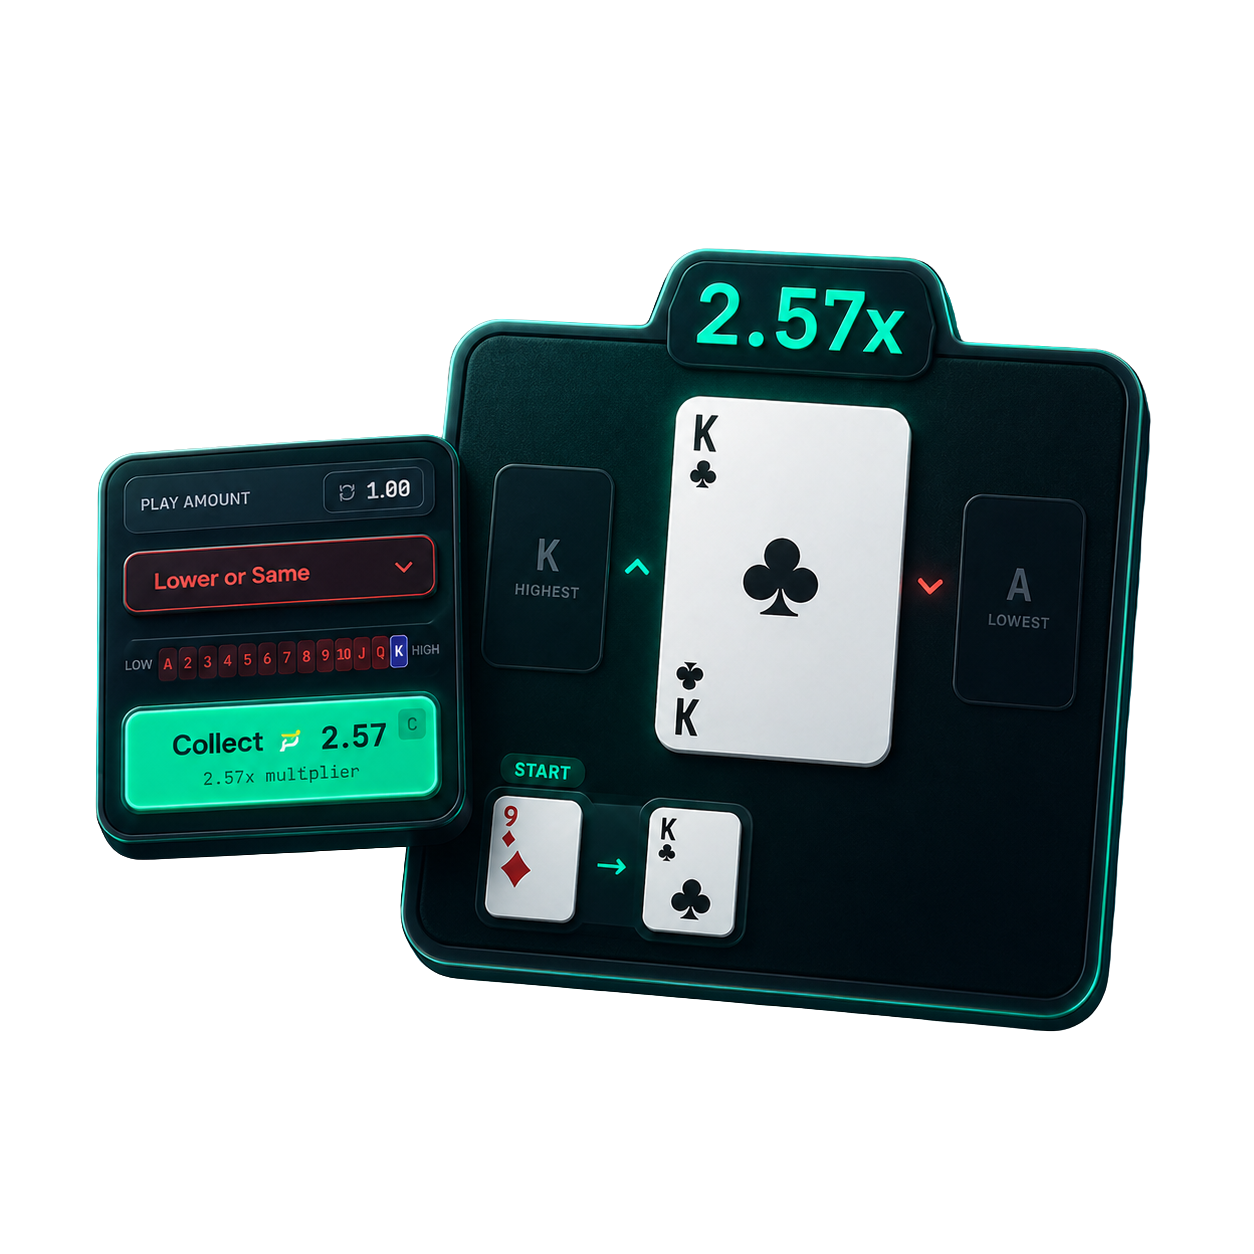
Guess. Stack. Collect.
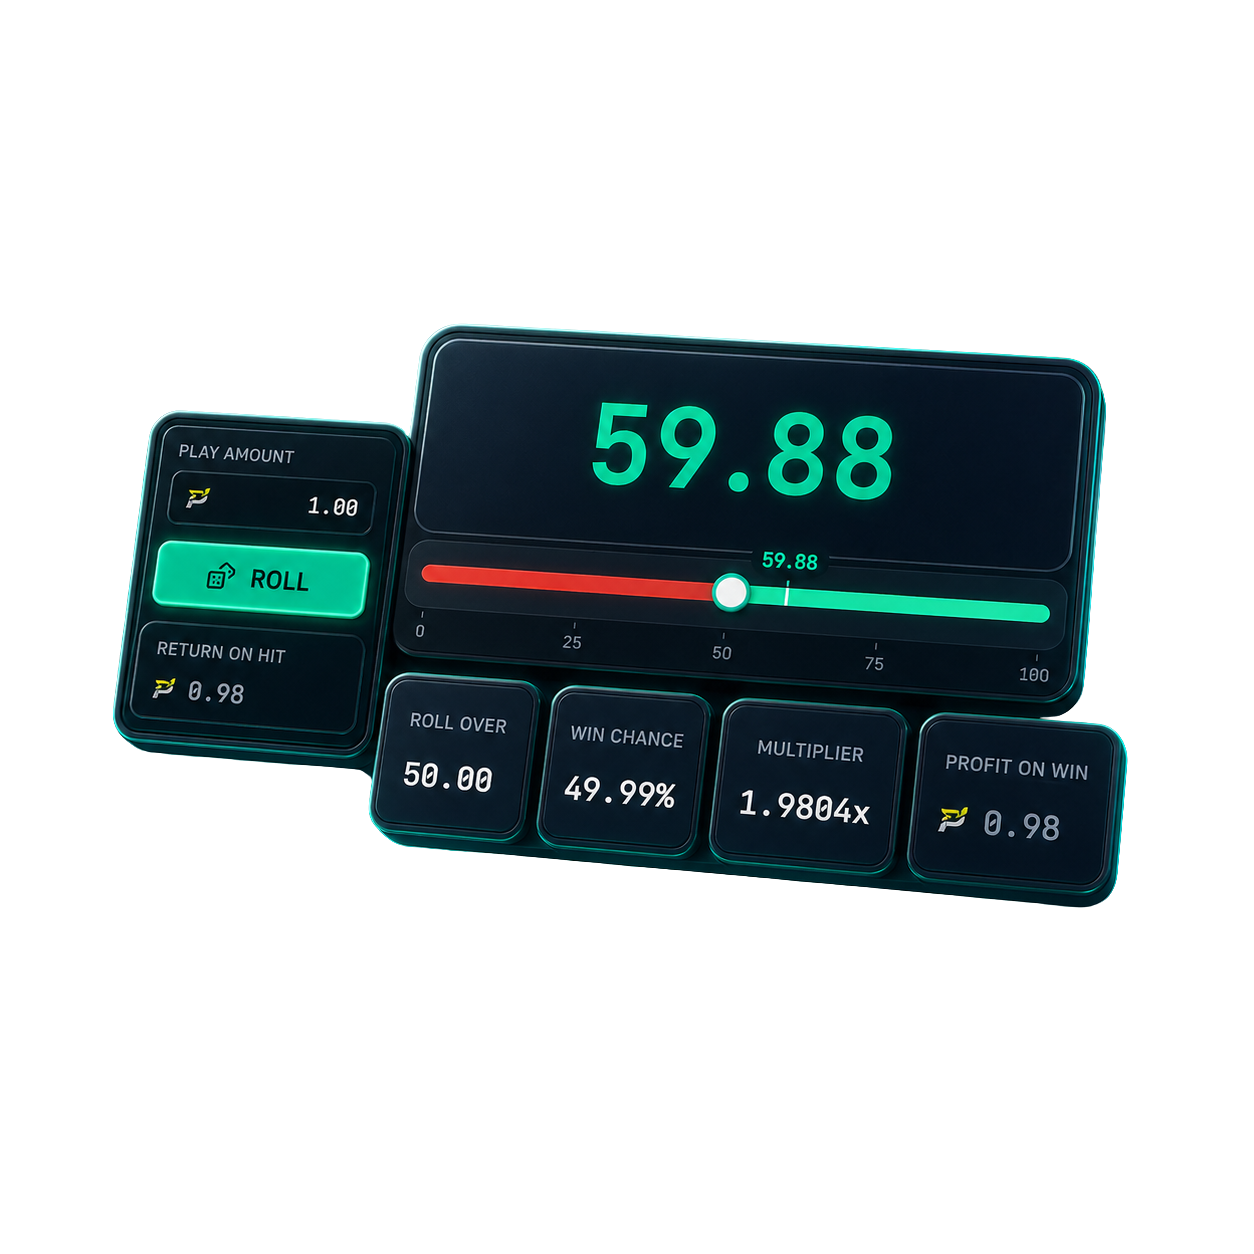
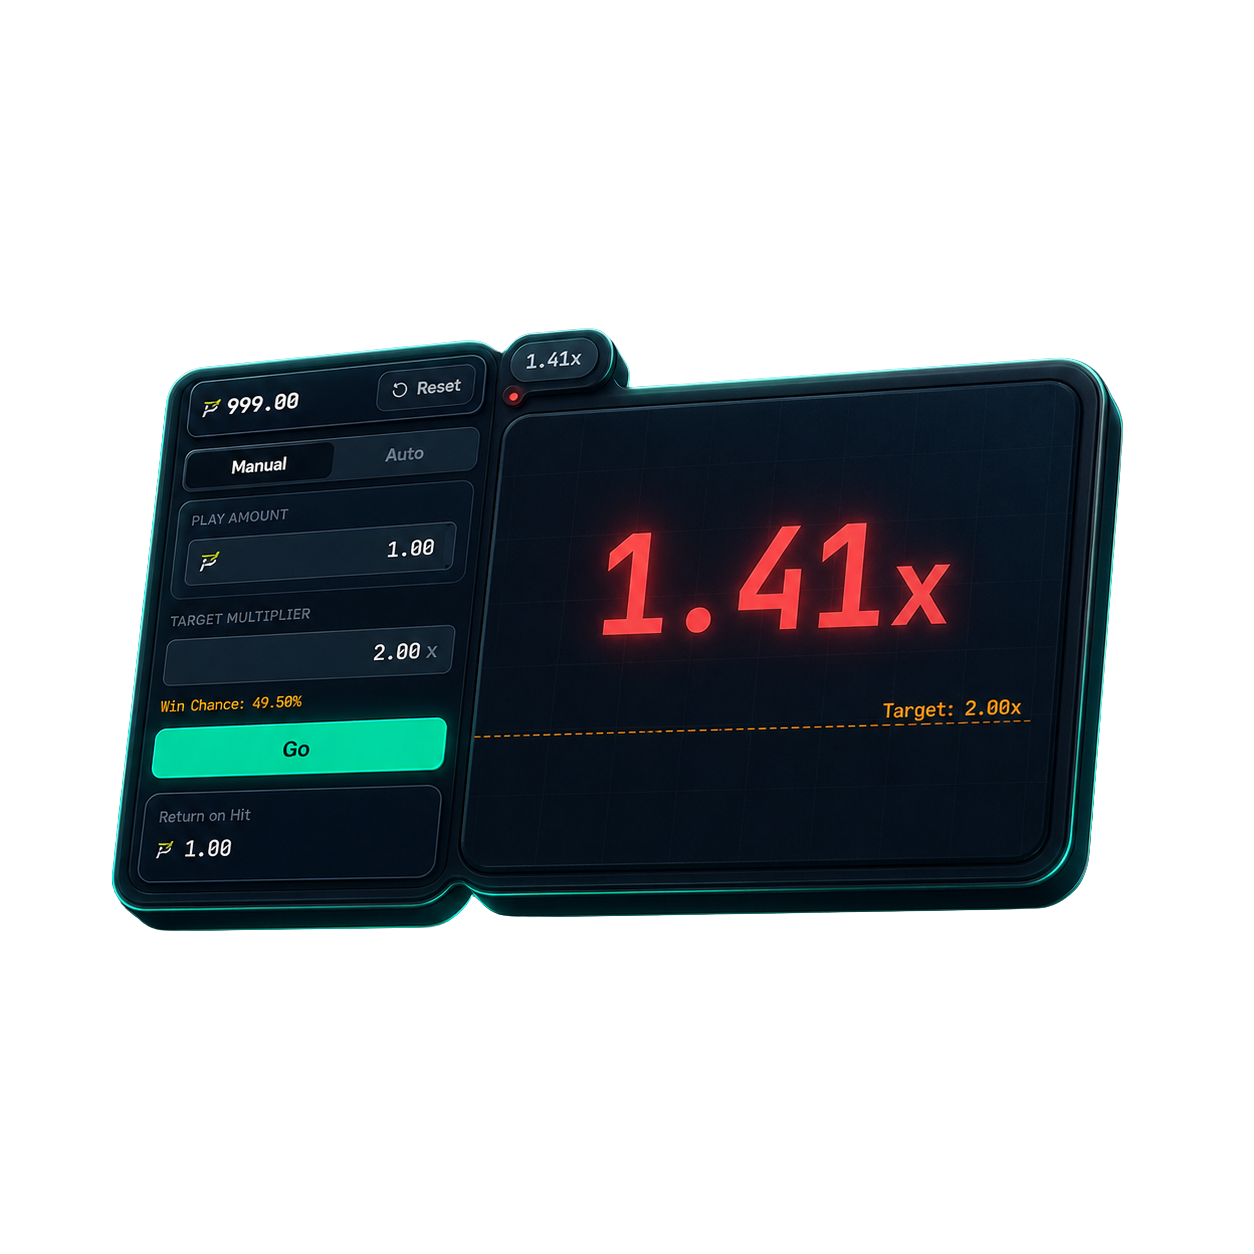
Set. Roll. Multiply.
Target. Launch. Instant.
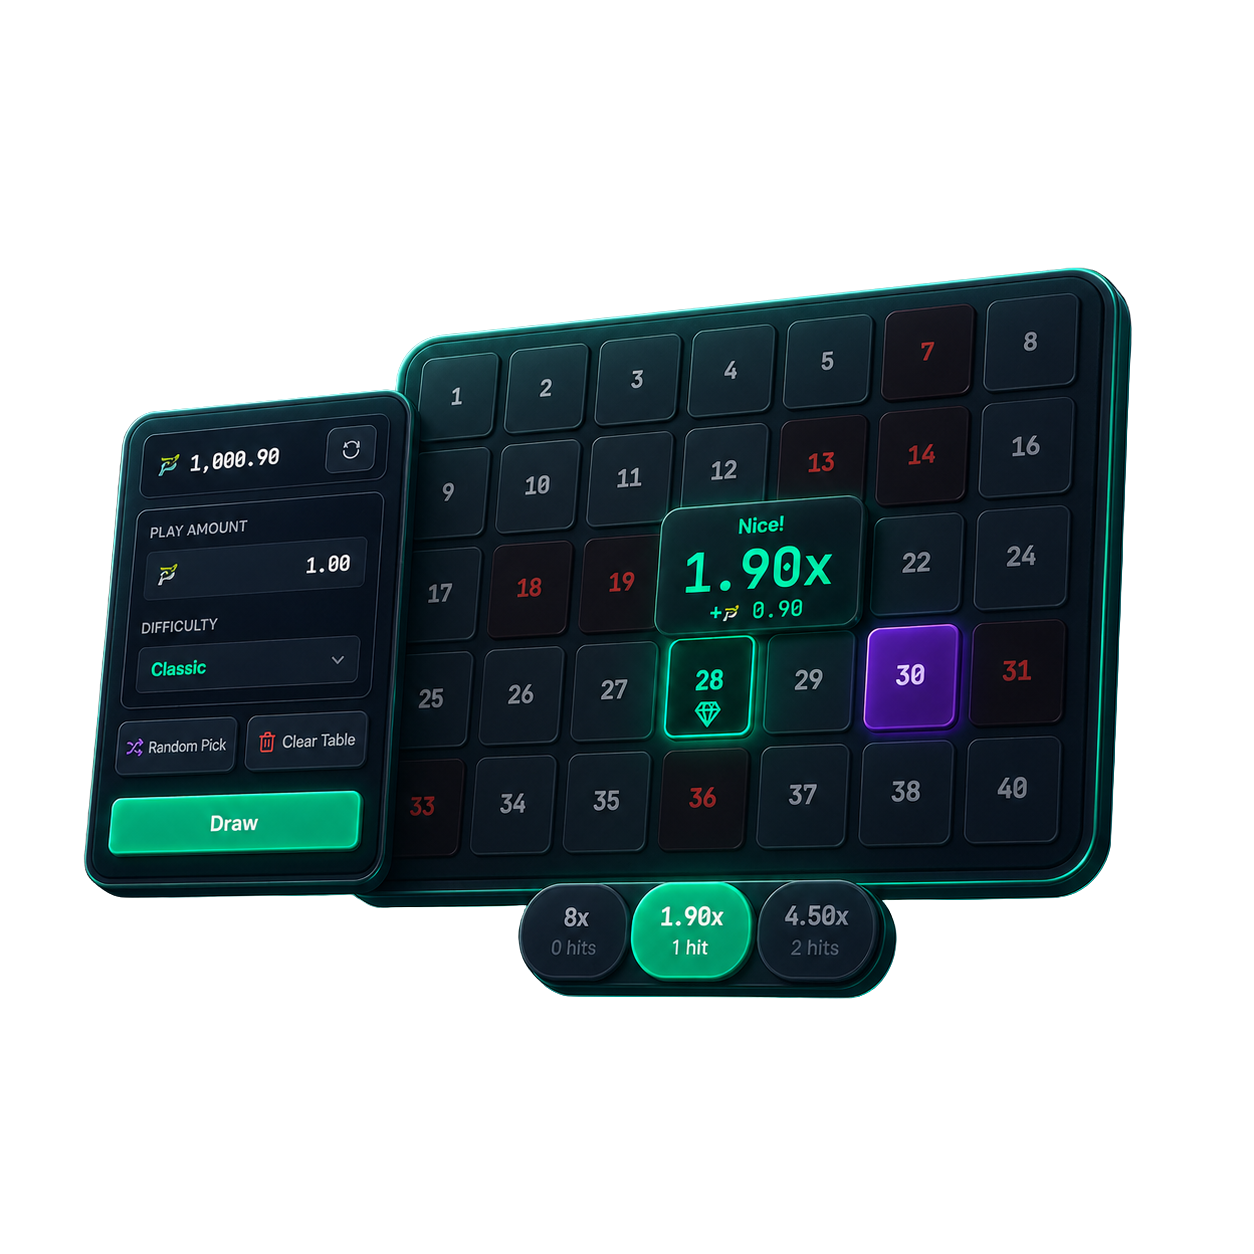
Pick. Match. Multiply.
This is a free mathematical simulation for educational purposes. No real money is used.